
GEOGRAPHY OVERVIEW
EARLY STAGE 1
|
STAGE 1
|
STAGE 2
|
STAGE 3
|
|
Features of Places
|
The Earth's Environment
|
Factors that Shape Places
|
Even Year
Term 3/4
|
My Place and My Family
|
Exploring Places
|
Places are Similar and Different
|
A Diverse and Connected World
|
NSW Syllabus for the Australian Curriculum Geography
Organisation of Content - Board of Studies NSW Syllabus for the Australian Curriculum - Geography
|
|
|
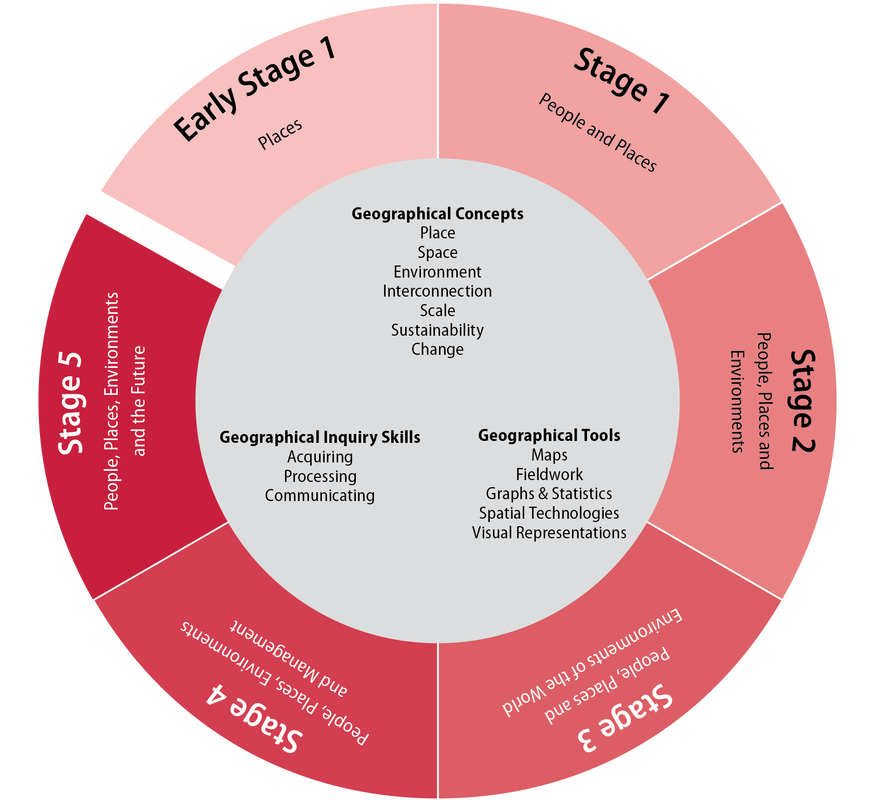
Geography Objectives
KNOWLEDGE AND UNDERSTANDING Students: • develop knowledge and understanding of the features and characteristics of places and environments across a range of scales • develop knowledge and understanding of interactions between people, places and environments. SKILLS Students: • apply geographical tools for geographical inquiry • develop skills to acquire, process and communicate geographical information. VALUES AND ATTITUDES Students will value and appreciate: • Geography as a study of interactions between people, places and environments • the dynamic nature of the world • the varying perspectives of people on geographical issues • the importance of sustainability and intercultural understanding • the role of being informed, responsible and active citizens. |
Geographical Concepts
|
Geographical Inquiry Skills
The stages of a complete inquiry are:
Acquiring geographical information • identify an issue or problem • develop geographical questions to investigate the issue or problem • collect primary geographical data • gather geographical information from secondary sources • record information Processing geographical information • evaluate data and information for reliability and bias • represent data and information in appropriate forms • interpret data and information gathered • analyse findings and results • draw conclusions Communicating geographical information • communicate the results using a variety of strategies appropriate to the subject matter, purpose and audience • reflect on the findings of the investigation; what has been learned; the process and effectiveness of the inquiry • propose actions and predict outcomes • where appropriate, take action. |
Geographical Tools
MAPS – M
Maps take many forms and include digital and non-digital mediums. Examples include, but are not limited to, pictorial maps, large-scale and small-scale maps, relief maps, choropleth maps, flowline maps, cadastral maps, isoline maps, land use maps, physical maps, political maps, précis maps, road maps, thematic maps, topographic maps and special-purpose maps. Maps are used to locate, visualise, represent, display and record spatial data.
FIELDWORK – F
Fieldwork is an integral and mandatory part of the study of Geography as it facilitates an understanding of geographical processes and geographical inquiry. Fieldwork can enhance learning opportunities for all students because it caters for a variety of teaching and learning approaches. The enjoyable experience of active engagement in fieldwork helps to create and nurture a lifelong interest in and enthusiasm for the world students live in.
GRAPHS AND STATISTICS – GS
Graphs, also called charts, take many forms and include digital and non-digital mediums. Examples include, but are not limited to, tally charts, pictographs, column graphs, line graphs, pie graphs, weather charts, climate graphs and population profiles.
Statistics also take many forms and include digital and non-digital mediums. Students will begin with basic data tables and progress to complex representations of statistics on common themes.
Graphs and statistics are used to collate, organise, illustrate, summarise and compare patterns, relationships and trends in geographical data and information.
SPATIAL TECHNOLOGIES – ST
Spatial technologies include any software or hardware that interacts with real world locations. Examples include, but are not limited to, virtual maps, satellite images, global positioning systems (GPS), geographic information systems (GIS), remote sensing and augmented reality. Spatial technologies are used to visualise, manipulate, analyse, display and record spatial data.
VISUAL REPRESENTATIONS – VR
Visual representations take many forms and include digital and non-digital mediums. Examples include, but are not limited to, diagrams, images, photographs, paintings, illustrations, symbols, models, posters, collages, cartoons, multimedia, infographics and mind maps. Visual representations are used to display, visualise, analyse and communicate geographical data and information.
